

What the Shape of the U.S. Treasury Yield Curve Suggests About Economic Expectations
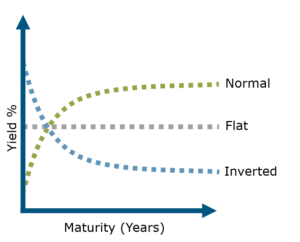 The yield curve for U.S. Treasuries (yield curve) refers to the relationship between the yield on short-term U.S. Treasury bills and progressively longer-term Treasury notes and bonds. In general, Treasury bills are issued with terms to maturity of one year or less. By contrast, Treasury notes and bonds are issued with longer terms to maturity of between 2- and 10-years and 10- and 30-years, respectively. The shape of the yield curve refers to the relative difference, or “spread,” between longer-term and shorter-term yields. While the shape of the yield curve is constantly evolving in response to a myriad of factors, there are three commonly referenced yield curve formations: normal, flat, and inverted.
The Normal Yield Curve
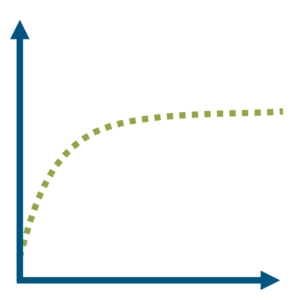 A normal yield curve is characterized by lower yields for shorter-term maturities and progressively higher yields for longer-term maturities. A normal yield curve is the most common and generally reflects a stable and expanding economy. The relative steepness of a normal yield curve can provide clues about the current and expected pace of economic activity. For example, a comparatively steeper normal yield curve can reflect accelerating rates of economic growth while a less steep normal yield curve can reflect a slowing pace of economic expansion.
The Flat Yield Curve
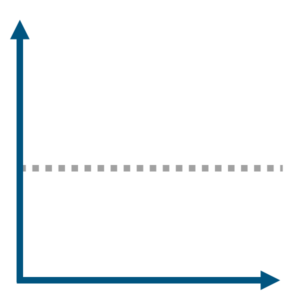 As implied by its name, a flat yield curve is characterized by similar yields across both short-term and long-term maturities. In general, a flat yield curve often reflects uncertain or deteriorating economic conditions. Against a backdrop of economic uncertainty, there is little differentiation between short-term and long-term yields, as they converge towards a common level. In a deteriorating economic environment, a flat yield curve may reflect concerns of further economic weakness.
The Inverted Yield Curve
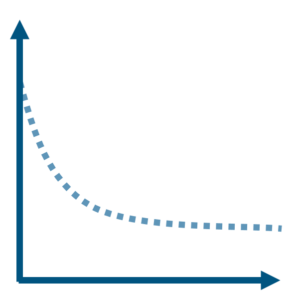 An inverted yield curve results when short-term yields are higher than longer-term yields. Inverted yield curves are rare and generally reflect periods of significant economic slowdown and possibly recession. Under such circumstance, investors may accept lower long-term yields because they believe economic conditions may deteriorate further and that short-term yields may be lowered to stimulate economic activity. Inverted yield curves have historically exhibited a strong correlation with economic recession.
The Yield Curve Today
The current yield curve inversion has been the subject of much attention and debate amongst market participants. The closely watched spread between the 10-Year U.S. Treasury Note yield and the 3-Month U.S. Treasury Bill yield turned negative in late October 2022 and has remained inverted for 476 consecutive days (as of February 13, 2024). This marks the longest continuous stretch that 10-Year Treasury yields have been below 3-Month Treasury yields in data going back to 1962. However, it’s not only the duration of inversion that has stood out this cycle. In addition to its longevity, the current yield curve inversion has been the deepest in over 40 years , adding to concerns that this notoriously reliable indicator may again be sounding the recession alarm.
Despite these concerns, the U.S. economy remained remarkably resilient in 2023 as strong consumer spending and robust labor market conditions underpinned growth. While the current inversion has not yet returned to a normal, upward-sloping yield curve, the economy’s persistent resiliency has led some market participants to believe that the U.S. economy may be heading for a “soft landing” rather than a recession . Notwithstanding this growing optimism, the Federal Reserve Bank of New York’s recession probability model for the next twelve months, which is based upon the spread between 10-year and 3-month Treasury yields, remains highly elevated at 61.47%.
As we enter the new year, the U.S. economy stands at a critical juncture with the U.S. Treasury yield curve remaining inverted, historically signaling the heightened possibility of recession. The key question remains: Will the economy’s strength prevent a downturn, or will the yield curve inversion prove to be a reliable predictor of recession once more?
Data as of February 13, 2024. Source: Public Trust Advisors, LLC and Bloomberg. Many factors affect performance including changes in market conditions and interest rates and in response to other economic, political, or financial developments. Investment involves risk including the possible loss of principal. No assurance can be given that the performance objectives of a given strategy will be achieved. All comments and discussions presented are purely based on opinion and assumptions, not fact. These assumptions may or may not be correct based on foreseen and unforeseen events. The information presented should not be used in making any investment decisions. This material is not a recommendation to buy, sell, implement, or change any securities or investment strategy, function, or process. Any financial and/or investment decision should be made only after considerable research, consideration, and involvement with an experienced professional engaged for the specific purpose. Past performance is not an indication of future performance.